> ## Documentation Index
> Fetch the complete documentation index at: https://docs.toolken.ai/llms.txt
> Use this file to discover all available pages before exploring further.
# Dashboard
> Five views out of the box: Overview, Cost, Usage, Performance, and Reliability. Each supports grouping and filtering by any dimension.
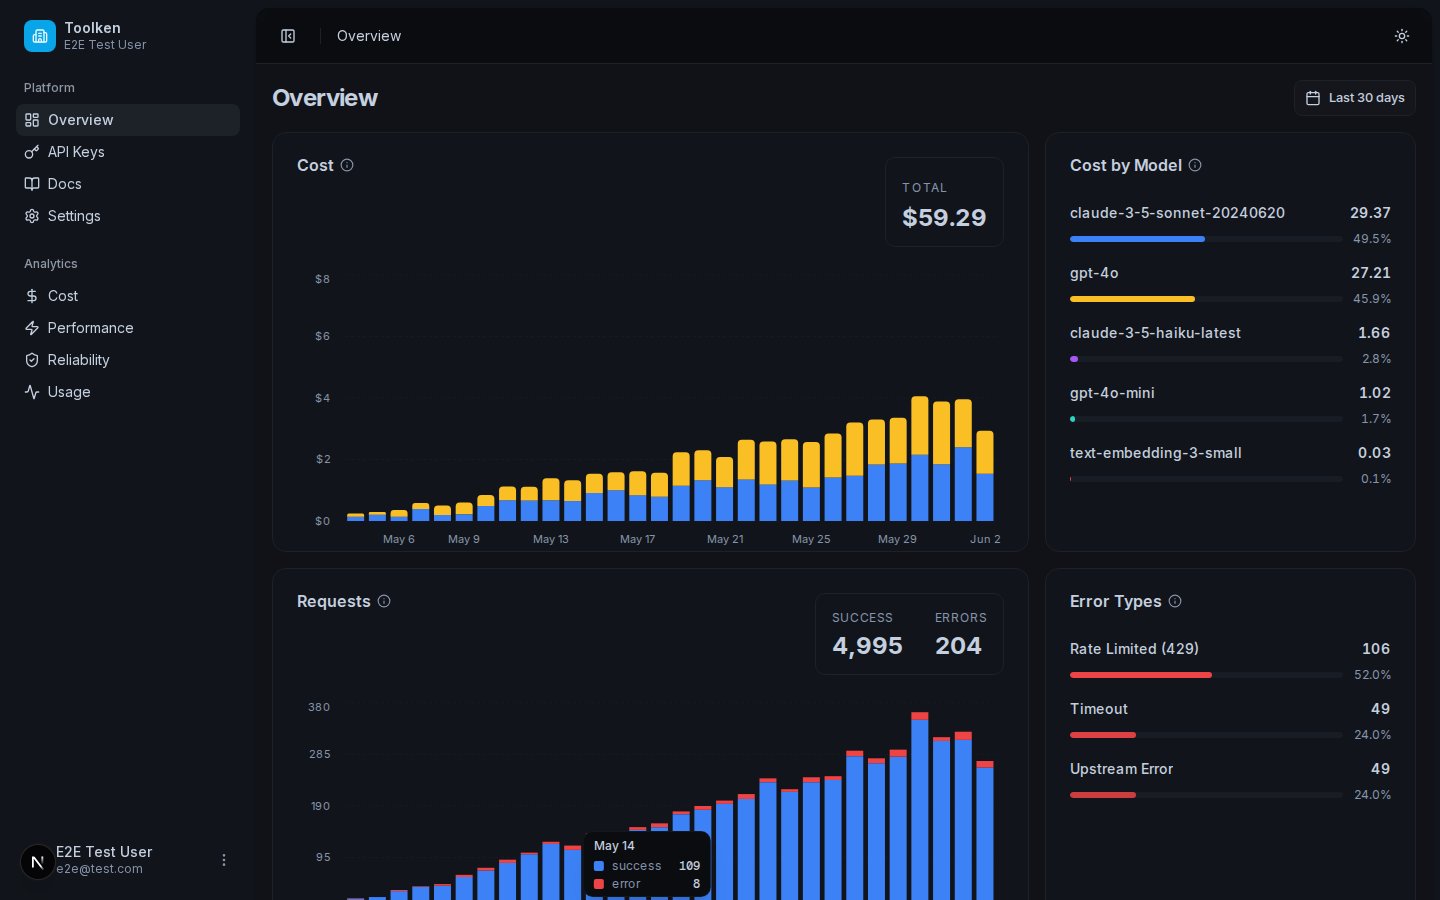
The dashboard surfaces everything Toolken records, organized into five views. You don't configure anything to see them. Data appears as soon as requests flow through the gateway.
 ## The five views
Account-level KPIs: total spend, request volume, token consumption, and error rate for the selected period. The starting point for a quick health check.
Spend over time, broken down by any dimension. Group by model, provider, environment, or any metadata key (agent, customer, feature...) to see where money is going.
Input, output, and cached token counts. Same group-by options as Cost. Useful for spotting which agents or customers drive token volume.
Latency and time to first token. Filter to a specific model or metadata tag to compare performance across them.
Error rates, status codes, and error types. Shows where requests are failing and which provider or agent is involved.
## Group by any dimension
Every view has a group-by control. Pick any built-in dimension or any metadata key you've sent:
* `model` or `provider` are available on every request.
* `environment` and `session_id` appear once you start sending `X-Toolken-Metadata-Environment` and `X-Toolken-Metadata-Session-Id`.
* Any other metadata key (`agent`, `customer_id`, `feature`, `tier`, ...) appears as soon as you send it via `X-Toolken-Metadata-*` or `X-Toolken-Metadata`.
Switch the group-by and the chart re-renders. No page reload, no extra config.
## Period selector
Each view has a period selector. Choose Last 7 days, Last 30 days, or Last 90 days. The period applies to the chart, the summary numbers, and any group-by in that view.
## Reliability: what you see
The Reliability view shows:
| Signal | What it tells you |
| --------------------- | ------------------------------------------------------------- |
| Error rate | Share of requests that returned an error, over time. |
| Status code breakdown | Which HTTP status codes your requests returned. |
| Error type breakdown | Gateway errors vs. upstream provider errors, grouped by type. |
Filter by any metadata key (agent, customer, feature) to see whether a specific part of your system is driving failures.
## Nothing to configure
The dashboard works from traffic alone. If a request carries no tags, it shows up under model and provider. Add any `X-Toolken-Metadata-*` header and that metadata key appears in the group-by controls automatically.
## Next
Add headers to tag requests and unlock every dimension.
How grouping and filtering work across views.
## The five views
Account-level KPIs: total spend, request volume, token consumption, and error rate for the selected period. The starting point for a quick health check.
Spend over time, broken down by any dimension. Group by model, provider, environment, or any metadata key (agent, customer, feature...) to see where money is going.
Input, output, and cached token counts. Same group-by options as Cost. Useful for spotting which agents or customers drive token volume.
Latency and time to first token. Filter to a specific model or metadata tag to compare performance across them.
Error rates, status codes, and error types. Shows where requests are failing and which provider or agent is involved.
## Group by any dimension
Every view has a group-by control. Pick any built-in dimension or any metadata key you've sent:
* `model` or `provider` are available on every request.
* `environment` and `session_id` appear once you start sending `X-Toolken-Metadata-Environment` and `X-Toolken-Metadata-Session-Id`.
* Any other metadata key (`agent`, `customer_id`, `feature`, `tier`, ...) appears as soon as you send it via `X-Toolken-Metadata-*` or `X-Toolken-Metadata`.
Switch the group-by and the chart re-renders. No page reload, no extra config.
## Period selector
Each view has a period selector. Choose Last 7 days, Last 30 days, or Last 90 days. The period applies to the chart, the summary numbers, and any group-by in that view.
## Reliability: what you see
The Reliability view shows:
| Signal | What it tells you |
| --------------------- | ------------------------------------------------------------- |
| Error rate | Share of requests that returned an error, over time. |
| Status code breakdown | Which HTTP status codes your requests returned. |
| Error type breakdown | Gateway errors vs. upstream provider errors, grouped by type. |
Filter by any metadata key (agent, customer, feature) to see whether a specific part of your system is driving failures.
## Nothing to configure
The dashboard works from traffic alone. If a request carries no tags, it shows up under model and provider. Add any `X-Toolken-Metadata-*` header and that metadata key appears in the group-by controls automatically.
## Next
Add headers to tag requests and unlock every dimension.
How grouping and filtering work across views.